Software testing metrics are comprehensive tools to measure software quality, cost, and effectiveness. By estimating these parameters, you can achieve high quality for the product with optimized use of costs and time.
At Codica, we thoroughly approach each software project and test it for bugs and errors. Thus, we share our expertise in this article. It will give you insights on how to apply testing metrics to your development process. So you get a bug-free and high-quality product to delight your customers.
Let’s look at testing metrics and how you can calculate and apply them.
Definition of software testing metrics
This concept refers to the tools for quantifying the software testing process. Metrics are a valuable tool in quality assurance services. With testing metrics, you can find the extent, dimension, size, or capacity of the product or its features. Also, you can use the metrics to measure teamwork efficiency. Thus, you can identify problem areas and make relevant improvements.
Below is an image highlighting examples of software testing metrics. Read the sections on manual and automated metrics for a more detailed discussion.
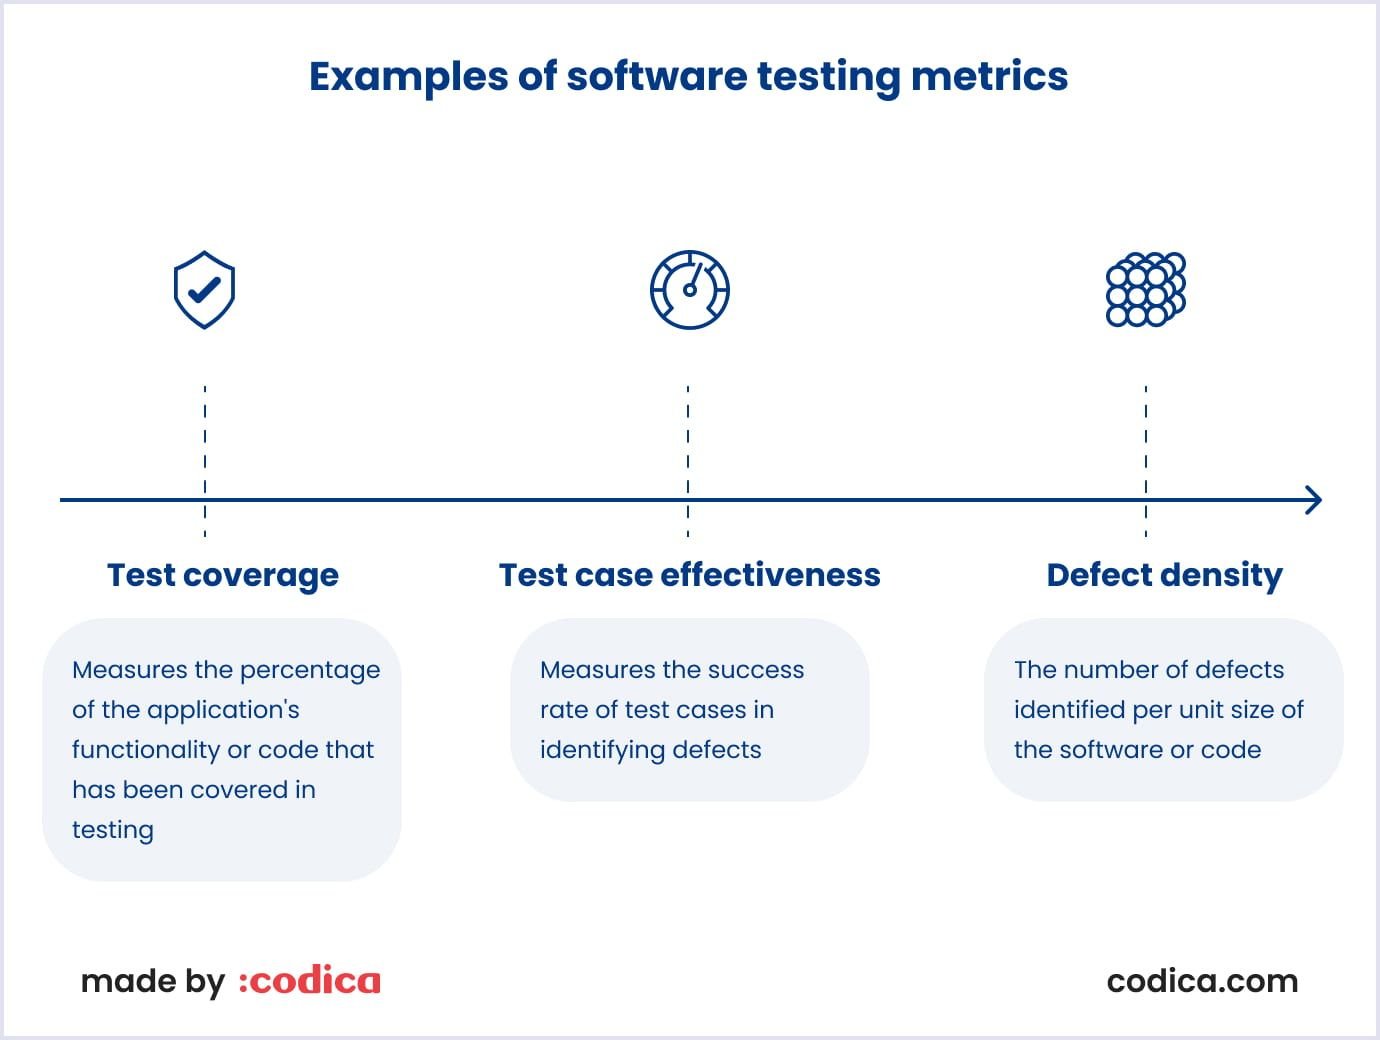
The metrics help get a quantitative result, and you can use that outcome to understand if the testing tool or process works nicely. Let’s take an automation tool as an example of measuring test process efficiency. Without the tool, we would have had 50% test coverage. But with the instrument, our test coverage grew to 66%. The figures show that efficiency grew by 16% with the introduction of the automation tool.
Importance of testing metrics
Metrics for software testing are vital in determining software’s healthy lifecycle. Also, metrics help measure the effectiveness of the test team’s work, optimizing it. So, what are the benefits of testing metrics? Let’s see.
- Metrics in software testing help ensure the product has high quality and performance. Metrics also provide information on the testing process regarding time and cost.
- The team and stakeholders can decide on process improvements based on specific data. For example, the parties can adjust the project schedule and cost estimates based on the testing metrics.
- With the numerical data from testing metrics, the testing team can examine the selected technology and approach. So the testing team can modify them if needed.
Before defining software performance testing metrics, it is crucial to take preparatory steps to help understand the project requirements. For this, you should consider the following aspects:
- Define the target audience for which the project is developed;
- Outline the goal for which the standards were created;
- Determine the measures based on the project requirements;
- Formulate the financial benefits received with every statistic;
- Relate the measurements to the development lifecycle for better results.
With the above steps, you can understand which metrics to select and how they will improve your testing process.

Types of software testing metrics
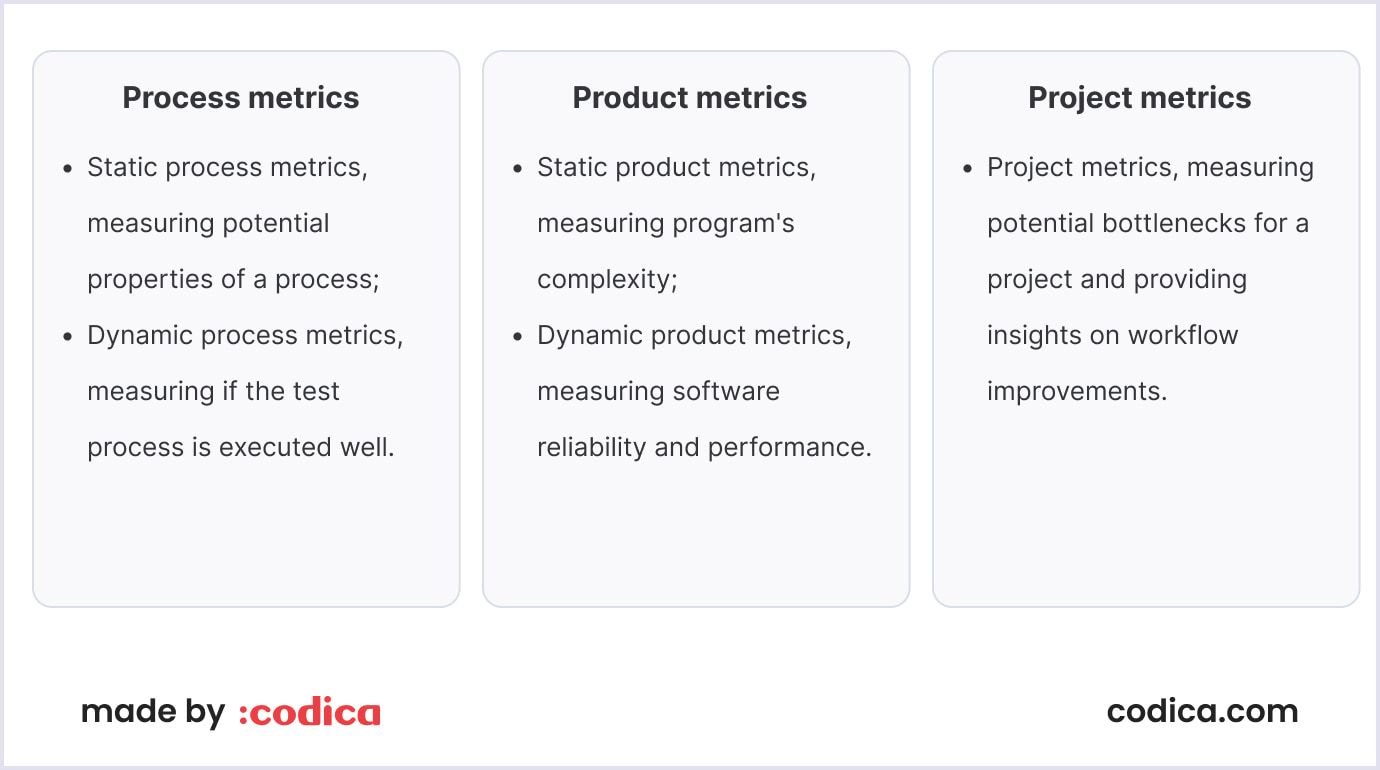
There are various types of testing metrics. You can split them into three main groups relating to the testing process, product, and project. Below, we consider the groups in more detail.
Process metrics
These metrics help explore the process's performance and evolution with quantitative and qualitative measurements. You can use process metrics to determine if your current tests are efficient in terms of speed, accuracy, and completeness. Taking these measurements and comparing them to earlier results helps you make changes. Thus, you will improve the ongoing processes.
The typical way to express findings in these measurements is in ratios and percentages. Three process metrics of software testing can help you measure performance and effectiveness. They are as follows:
Static process metrics. They measure potential properties a process can include, like the number of tests you can perform. You can think of static process metrics as constituting fragments of the software development process.
Dynamic process metrics. These measurements show if the test process is performing well. For example, they show the number of tests you ran on a software element. Also, they can show the elapsed time for an activity or the number of artifacts created.
Process evolution metrics. They show the amendments you make to a process over time. For example, the metrics measure the number of tests you can increase for running a software element test in a year.
Product metrics
These quality metrics in software testing show the product’s quality. Product metrics help QA (quality assurance) specialists and companies measure if the product has excellent features and works well. In this case, you can measure the tested software's size, design, and complexity. The outcome of these measurements helps you understand where the product performs well and where you can improve it.
Product metrics can be static or dynamic. We discuss their specifics below:
Static product metrics are used to measure the program’s complexity. You can use design and documentation for this. Static metrics do not have a direct connection to quality attributes. Nevertheless, such metrics are essential to understanding how easy it is to support and maintain the product.
Dynamic product metrics are collected while the tested program is in execution. This way, you can measure the reliability and performance of the software. For instance, you can test the execution time for specific tasks. Also, dynamic metrics allow QA specialists to measure the system startup time. Both are vital for assessing the software's efficiency and reliability.
Project metrics
These are measurements for general testing team processes. So project managers can see the testing task’s progress and detect potential risks. The metrics help pinpoint the workflow areas to be improved and leverage the testing team’s capacity. Thus, the output will be of high quality. Generally, project metrics are used to make the following improvements:
- Identify potential risks and make the relevant corrections to avoid delays;
- Continuously monitor the product and remove technical flaws as they arise;
- Track errors at each development stage;
- Measure function points, developed models, and delivered code.
The team can track project progress, assess the risks, manage problem areas, and improve product quality thanks to project metrics. As a result, the team can remove errors and defects. So, the development and testing processes become more cost- and time-effective.
That is why we applied these metrics to testing an online news portal. The project comprised several platforms intertwined into one platform. So, it was for our quality assurance team as if we were facing several projects in one. The video below shows how you can use the portal on mobile devices.
The platform has more than 17 websites for different African countries. The portal targets mobile users and can serve up to 1,000 users at once. Even with 1 million views per month, the platform works perfectly without downtime.
As the platform processes loads of images and other data, our team optimized it for slow Internet connections. So, now, users in the most remote parts of Africa can access the news aggregator.
Thanks to applying process testing metrics, we checked the efficiency of the testing process at every stage. With product testing metrics, our QA specialists helped developers deliver a high-quality product with excellent usability.
This project was part of our minimum viable product development services. It took a lot of work regarding its versatility and data load. Yet, by applying our development and testing expertise, we created a refined product with diverse features and scalability.
Read also: Test Driven Development: Key Benefits and Disadvantages for Your Project
Role of manual test metrics
With these metrics, QA professionals ensure product quality without using automation tools and frameworks. While it may be time-consuming, manual testing helps tackle complex scenarios. The two main metrics used for manual testing are base metrics and calculated metrics. Let’s discuss these types of metrics in software testing in more detail.
Base metrics
They are also called absolute metrics. Testers collect these foundational metrics as they develop and execute test cases. Base metrics include the following assessments:
- Test cases written/executed;
- Test cases passed/failed/blocked/pending;
- A number of defects found/accepted/rejected/deferred;
- A number of critical/high/medium/low defects;
- A number of planned/actual test hours;
- A number of defects found during retesting/regression.
The data is essential for test leads and project managers. With these metrics, the team can assess the testing progress. If necessary, experts can make relevant adjustments.
Calculated metrics
Testers apply such measurements to get insights into the product’s and testing process performance. Calculated metrics are called derivative metrics and use base metrics as their foundation. After collecting and analyzing calculated metrics, a test lead can conclude the testing efficiency. Testers adjust at different levels if needed.
Typically, calculated metrics are used in test reports. That is why calculated measurements are vital for making informed decisions. While base metrics are raw material, the calculated metrics show precise numbers. Therefore, the test team can use them as support for an effective testing process. By optimizing testing procedures, QA specialists deliver high-quality products in a shorter time.
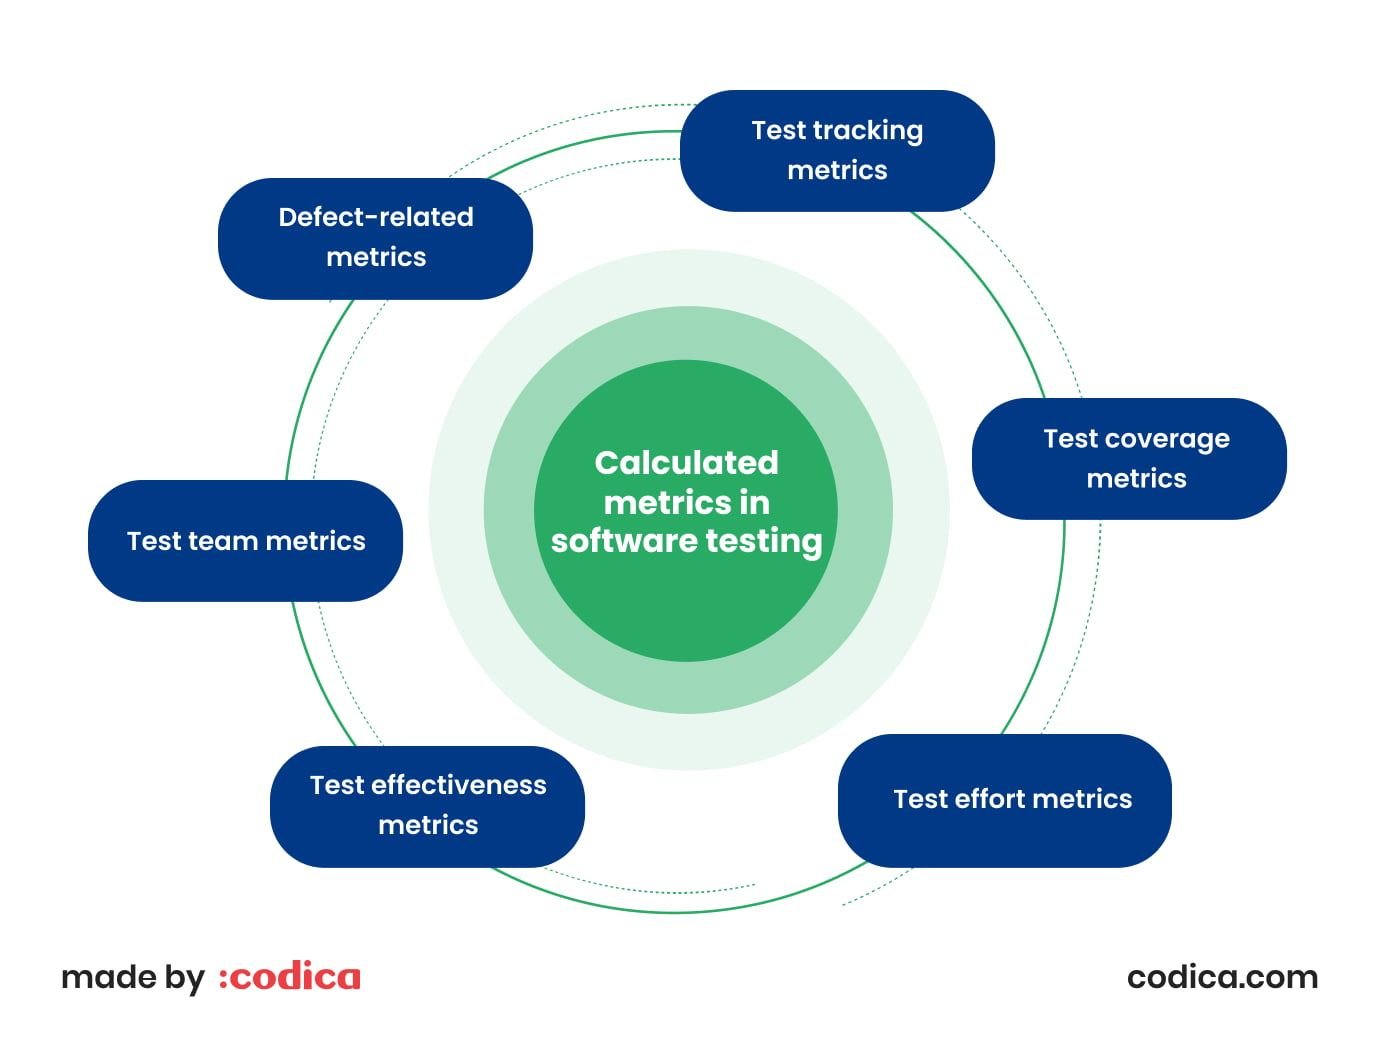
Below are several categories of calculated metrics you can use in testing management.
Test tracking metrics
They show the number of passed, failed and blocked tests. So you can understand which fragments need attention. Also, with these metrics, you can estimate the portion of testing or work done or left.
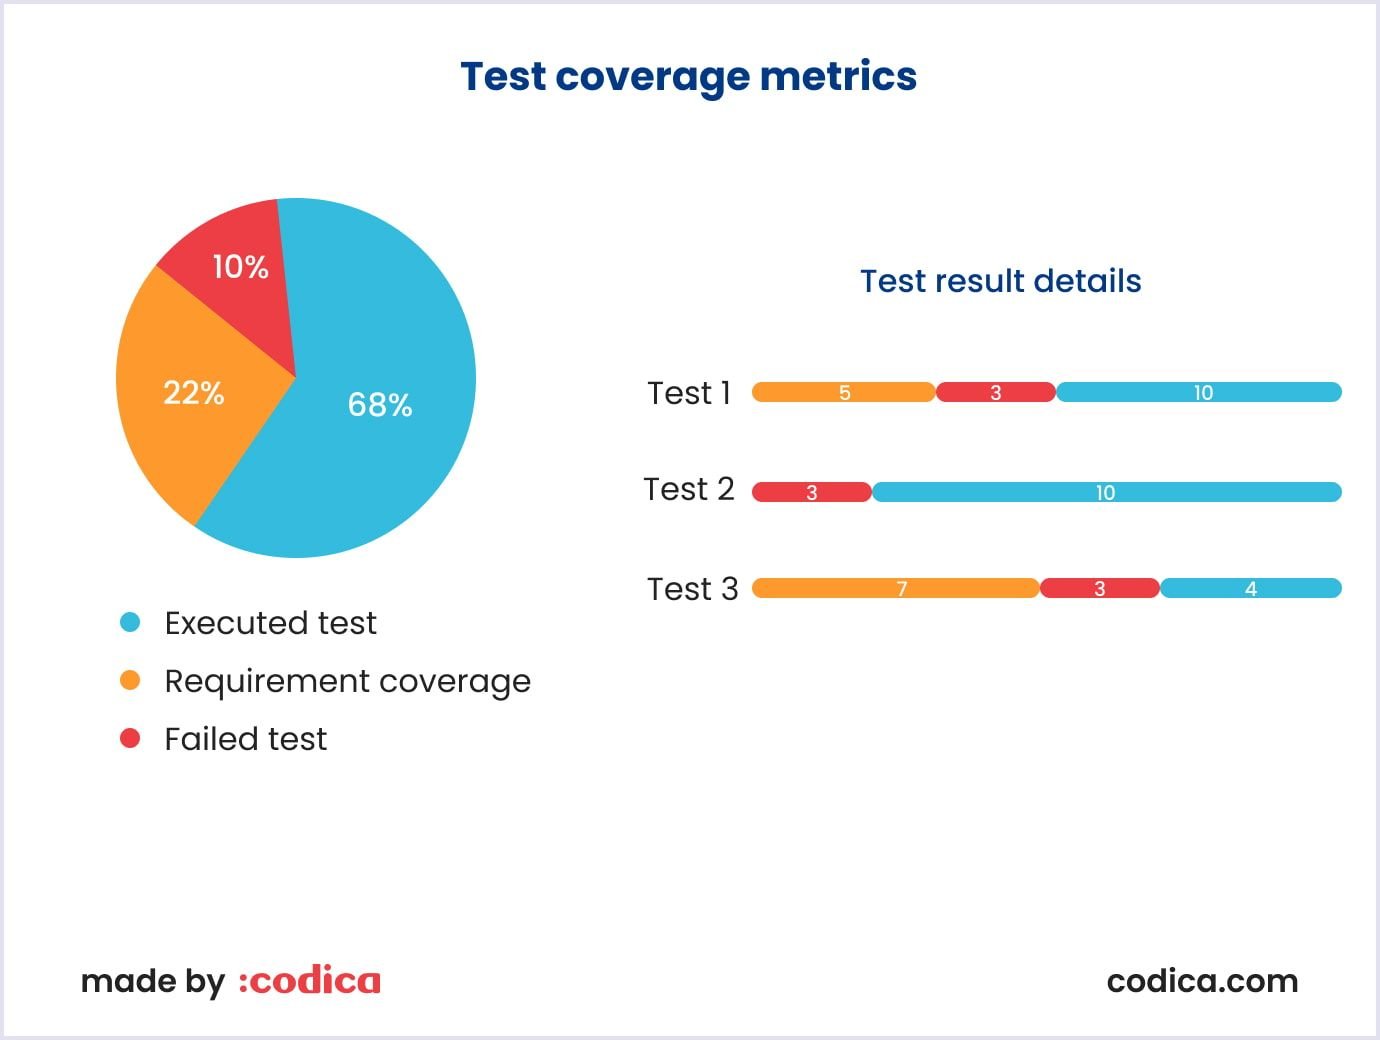
Test coverage metrics
Such measurements highlight what part of the software has been tested. Also, these metrics show how many requirements have already been fulfilled. For example, this approach helps detect test cases based on requirements and tasks covered and not covered in the testing process.
Test effort metrics
It is a range of metrics showing the number of tests designed, performed, and reviewed. The metrics show estimates of the efficiency and timing of testing processes. The measurements help understand, for example, how many tests are left to be done and how long it will take.
Test effectiveness metrics
These metrics embrace measurements to estimate the value of the test set. The test’s effectiveness can be less than 100%. Still, try to reach as high a level as possible. Higher test effectiveness means a better test set and lower effort for long-term maintenance.
Test team metrics
Metrics for software testing process outline the load per test team member. The metrics cover how many test cases a tester has completed. So, measurements help you understand if there are enough tasks for a tester or if you can allocate more.
Defect-related metrics
These measurements highlight the number of defects discovered and eliminated. Also, the metrics show defect density, age, and removal efficiency. The results help you understand the percentage of errors in the system and measure the team’s work efficiency. For example, typical defect metrics are as follows:
- Defect cause shows what causes the defect;
- Defect severity helps understand if the defect seriously affects the product’s quality;
- Defect finding rate shows the pattern of errors detected over time;
- Defect fixing time outlines the time needed to repair a bug.
To conclude, we collected the typically used calculated metrics in the image below for a swift review.
These metrics were crucial when our team worked on a domain marketplace, Dan. We used this basic data to optimize the development and testing of the product. Thanks to the base and calculated metrics, we understood how to improve the testing process and what errors were found.
We also discovered how much time we spent testing and retesting. Our team saw that our efforts were well distributed and required the fewest possible resources.
The Codica professionals delivered a reliable and convenient domain portal through optimized testing processes based on metrics. Using the best practices of development and testing, our team brought high speed and enhanced convenience to the solution.
Now, users can scroll down one page with a domain list instead of switching between many tabs. We helped users with pricing options and the Sales page in a single popup window. So now, users can make changes in bulk.
Our team also added updates to table search and editing. Thanks to our enhancements, users can edit new fields and sort and hide columns. Functional improvements also cover a selection of domain categories and creating custom categories.
Due to general optimization and testing work, the marketplace became fast, stable, and secure. Check out the video below to see how the Dan solution works.
Role of automated test metrics
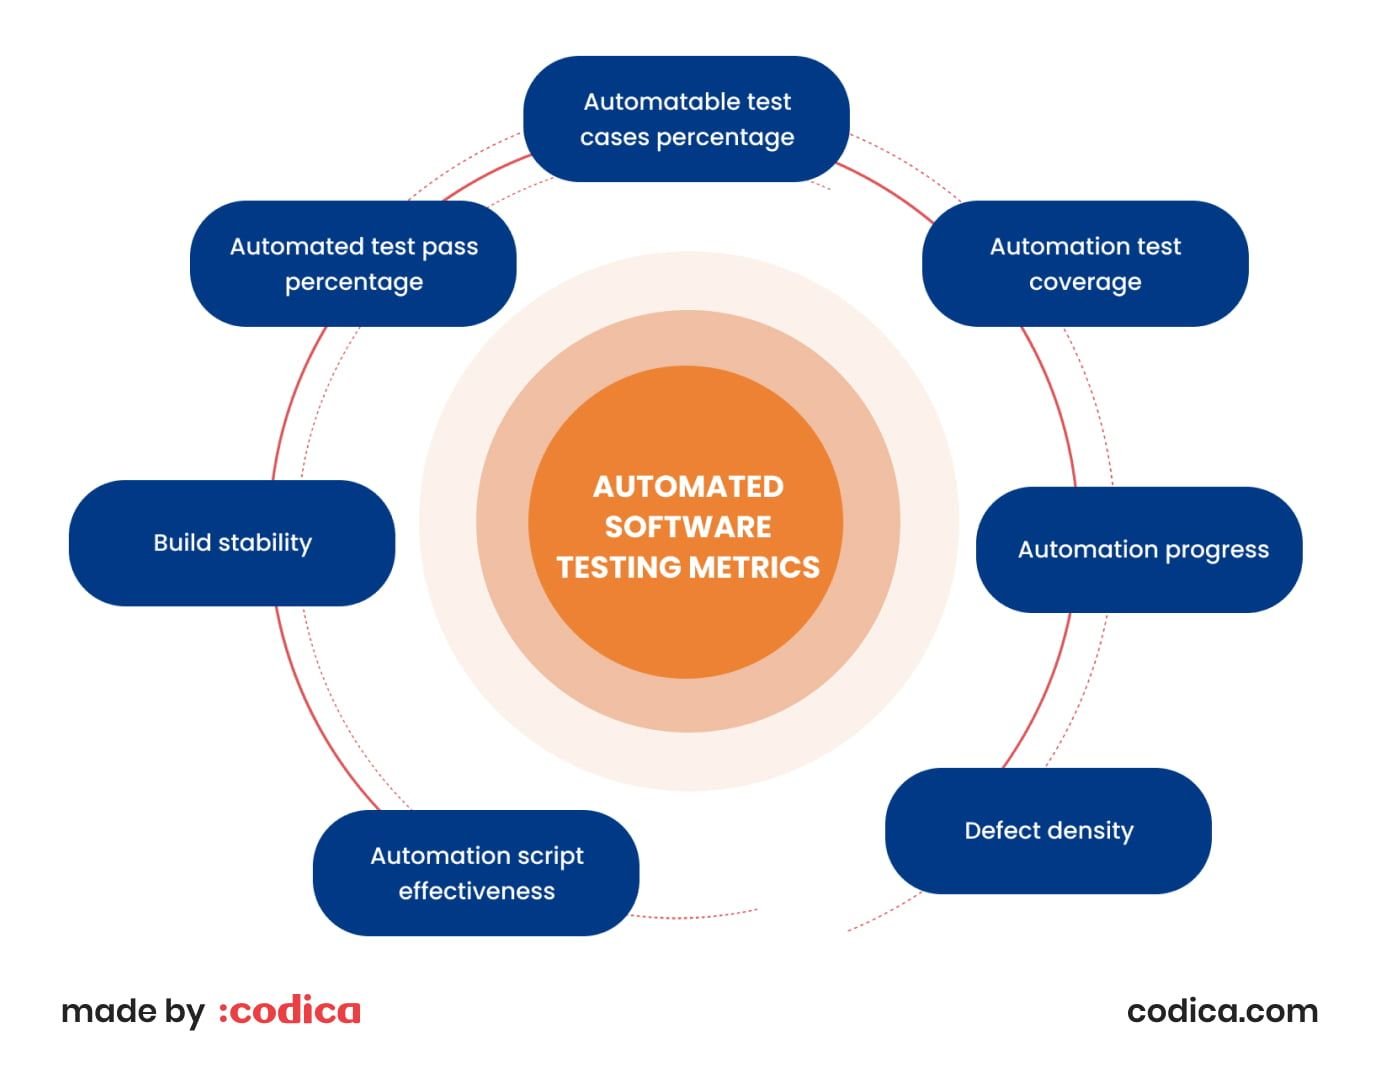
Besides manual metrics, there are automated testing measurements. QA teams and DevOps engineers can understand the testing processes' performance with automated test metrics. The commonly used automation test metrics are as follows:
Percentage of automatable test cases
At the beginning of the test process, a testing team can measure the rate at which test cases are automated. This metric helps define processes to be automated and those to be validated by testers.
Automation test coverage
The metric helps track the number of tests to be performed. The percentage shows the share of tests done automatically compared to those performed manually. The measurement shows if the QA team fulfills the automation test coverage goal or needs adjustments.
Automation progress
This assessment helps you estimate how many automated test cases have been executed over a period of time. Thus, the QA team will understand if there are deviations in the automation testing process due to changing tasks and their priority.
Defect density
This parameter estimates the total bugs, errors, and issues detected in software over a development cycle. By analyzing the defect density, the QA team can concentrate on vulnerable software parts requiring thorough testing.
Automation script effectiveness
It compares the total defects detected through automation testing to the number of acceptable errors in the project’s test management system. The metric helps understand the automation test script’s performance. If necessary, the test team will make adjustments.
Build stability
In testing, a build means a version of the software prepared for testing. The build stability metric helps find how many failures have occurred in a build. This approach reflects whether the software is stable enough to be passed to production.
Automated test pass percentage
This metric finds how many automation tests passed. It measures the stability and effectiveness of the chosen testing suite. The low failure rate proves that the automation script logic is correct. Meanwhile, a low pass rate signals that your testing suite needs adjustments.
Also, an essential thing to note is the importance of the passed tests. An unimportant condition may pass while the system does not work properly due to a significant issue.
Additional most used software metrics
Besides testing the software, there are teamwork and resource management processes. They influence the time needed for testing and define how the testing processes are optimized. The metrics used to estimate spending on testing include the following:
- The total allocated cost for testing shows planned spending on testing projects over a year;
- The actual testing cost reflects the real expense of testing;
- Budget variance determines the gap between planned and actual costs;
- Schedule variance defines the difference between the planned and actual time spent on testing;
- The cost per bug fix shows the expense of removing an error per developer;
- The cost of not testing reflects the amount that went for rework.
The results of economic metrics help you understand if testing resources are allocated wisely. So you can plan how to use the resources better. Such planning is the foundation for sound resource usage.

Test metrics life cycle
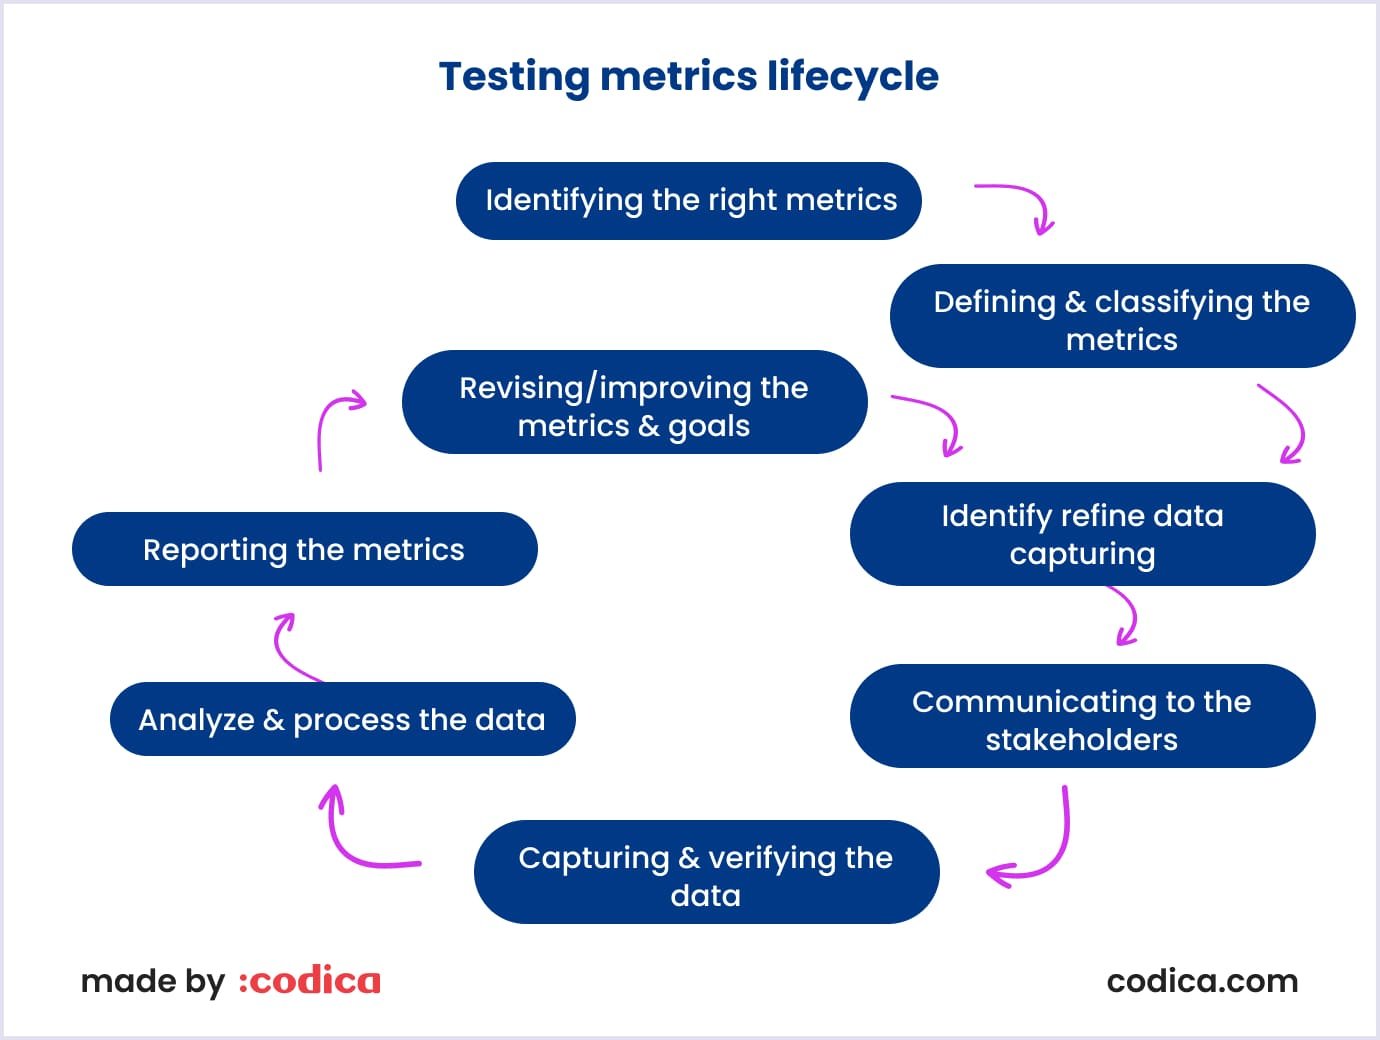
This concept describes the stages that testers take to develop, analyze, and use testing metrics. Generally, you start by selecting metrics for particular goals, such as fixing defects or checking progress. Then, you gather data from performance tests, logs, and bug-tracking tools. After that, you analyze the new information and report on how the software can be improved. Finally, you can make relevant changes to enhance the process or product.
Thus, the testing metrics lifecycle covers the following steps:
Analysis
- Selecting the appropriate testing metrics depending on the tasks and goals;
- Defining the adopted QA metrics.
Communication
- Informing the testing team and stakeholders of the metric requirements;
- Educating the QA team on data points that must be gathered to process the metrics.
Evaluation
- Capturing and verifying the data;
- Applying the data collected to calculate the metrics’ values.
Report
- Creating a sound and strong inference for the paper;
- Sharing the report with stakeholders and team members;
- Collecting input from stakeholder representatives.
The image below briefly represents the testing metric lifecycle stages.
Software test metrics calculation
To calculate testing metrics, you must pass through several steps. Each step has an outcome that determines the next actions you need to perform. Thus, you can solve the problems in certain testing areas and improve the overall test result. Look at the table below to see what problems you can encounter when calculating testing metrics and how to solve them.
| Number | Test metrics step | Example |
| 1 | Select the key software testing processes you need to measure. | Tracking process for testing progress. |
| 2 | Use the data as the baseline for selecting metrics. | The number of test cases a tester plans to execute per day. |
| 3 | Determine the data to be followed, the tracking frequency, and the designated person. | The test manager covers the actual number of test cases at the end of the day. |
| 4 | Calculate, manage, and interpret the defined metrics results. | The test cases that were actually executed per day. |
| 5 | Identify the areas of improvement based on the outcome you got with metrics. | The test case’s performance falls below the set goal. So we need to discover the reason and make relevant improvements. |
Bonus: formulas for testing metrics
This section covers software testing metrics examples you can use when checking a product's quality. Review the table below to find formulas for calculating specific metrics.
Manual tests
| Testing metrics | Parameter | Formula |
| Test effort | Number of tests run per time period | (No. of tests run / Total time) * 100 |
| Test design efficiency | No. of tests designed / Total time | |
| Test review efficiency | No. of tests reviewed / Total time | |
| Bug find rate | Total No. of defects / Total testing time (in hours) | |
| Number of bugs per test | Total No. of defects / Total No. of tests | |
| Average time to test a bug fix | Total No. of bug fixes to retest / Time spent for bug fixes (in hours) | |
| Test effectiveness | Test effectiveness | (No. of bugs found in test / No. of bugs found in test + No. of bugs found after shipping) * 100 |
| Test coverage | Test coverage | (No. of tests run / Total No. of tests to run) * 100 |
| Requirements coverage | (No. of tests run / Total No. of tests to run) * 100 | |
| Defects | Defects accepted | (No. of defects accepted as valid by a dev team / Total No. of defects reported) * 100 |
| Defects rejected | (No. of defects rejected as invalid by a dev team / Total No. of defects reported) * 100 | |
| Defects deferred | (No. of defects deferred for future releases / Total No. of defects reported) * 100 | |
| Fixed defects | (No. of defects fixed / Total No. of defects reported) * 100 | |
| Critical defects | (No. of critical defects / Total No. of defects reported) * 100 | |
| Mean time to detect (MTTD) | No. of defects found / Total execution time (in hours) | |
| Defect leakage | (No. of defects reported by users / Total No. of defects found) * 100 | |
| Defect severity index* | ((No. of critical defects * 8) + (No. of high severity defects * 6) + (No. of medium severity defects * 3) + (No. of low severity defects * 1)) / Total No. of defects |
* To calculate the defect severity index, testers assign a coefficient to each severity level:
- Critical errors - 8;
- High severity errors - 6;
- Medium severity errors - 3;
- Low severity errors - 1.
Typically, the defect severity index decreases over the testing cycle progress. So the index reaches a minimal value before the product launch. A comparison of the index values during the testing process shows if the testing strategy and workflow are efficient. If the index does not decrease as testing goes on, there are issues to address.
Automated tests
| Parameter | Formula |
| Automatable test cases | (No. of automatable test cases / Total No. of test cases) * 100 |
| Automation test coverage | (No. of automated tests / Total No. of tests) * 100 |
| Automation progress | (No. of actual test cases automated / No. of automatable test cases) * 100 |
| Defect density | (No. of known defects / Total system size) * 100 |
| Automation script effectiveness | (No. of defects detected by automation / No. of acceptable defects) * 100 |
| Build stability | (No. of build failures / No. of builds) * 100 |
| Automated test pass rate | (No. of passed cases / No. of test cases executed) * 100 |
Codica’s tips for choosing the right QA metrics
Our QA team is proficient in testing products for various domains. In our development and quality assurance services, we apply the best standards to optimize the workflow. As a result, our clients get their solutions in the shortest time with the least amount of resources spent.
Now that you know what metrics exist, here are some tips on selecting them for your project.
Coordinate metrics with your testing strategy. If you apply more manual or automation tests or combine them, use relevant metrics. Some metrics will fit your testing strategy better than others. For example, in manual testing, you might focus on test execution and defect metrics. Meanwhile, in automated testing, passed execution, broken builds, and test time will be priorities.
Coordinate metrics with your development strategy. The basic development methodologies are waterfall and agile. So, teams relying on the waterfall approach might focus on regression and test coverage metrics. Teams relying on agile methodology should emphasize the number of errors detected after a sprint or the number of errors found in production.
Keep tracking activities and results in balance. Metrics showing tests created and tests executed outline the team’s productivity. However, such metrics do not necessarily show the ultimate software quality or customer satisfaction. Metrics should be versatile and help you track both technical and business aspects.
Select metrics that are helpful and avoid redundancy. If you overuse metrics or apply too many different metrics, it can puzzle you. Instead of getting insights, you may be trapped in excessive measurements. So, choose the necessary set of metrics that will help you analyze the key processes or project aspects.
Choose metrics individually for each purpose. Different teams need specific metrics to measure the vital parameters for their work. For example, different metrics measure team productivity and help plan future projects. In the first case, testers should measure test effort, coverage, and effectiveness. At the same time, teams use the mean time to detect (MTTD) for future planning.
You may also like: How Automation Testing Helps Your Project
On a closing note
Quality management metrics in software testing are helpful tools. You can use them to measure the defects and understand the testing team’s progress. With a proper selection of metrics, testers discover the product's quality and guide developers if necessary.
The trick is to use them as needed. Selecting software testing metrics should be aligned with the development approach, testing strategy, and project goals. This way, the QA team gets the best insights into what to improve in the product and testing process. Thus, testing will lead to customer satisfaction and less spending for a client.
If you are searching for a professional team to test your project, welcome to Codica. We provide full-cycle development, from discovery to maintenance. Our team tests each product thoroughly so customers get functional and stable software. Check out our portfolio for more projects delivered by our team. If you have questions, contact us. We are eager to discuss the details of your project and will give you a free quote for it.

